The price action is bullish and market sentiment is optimistic.
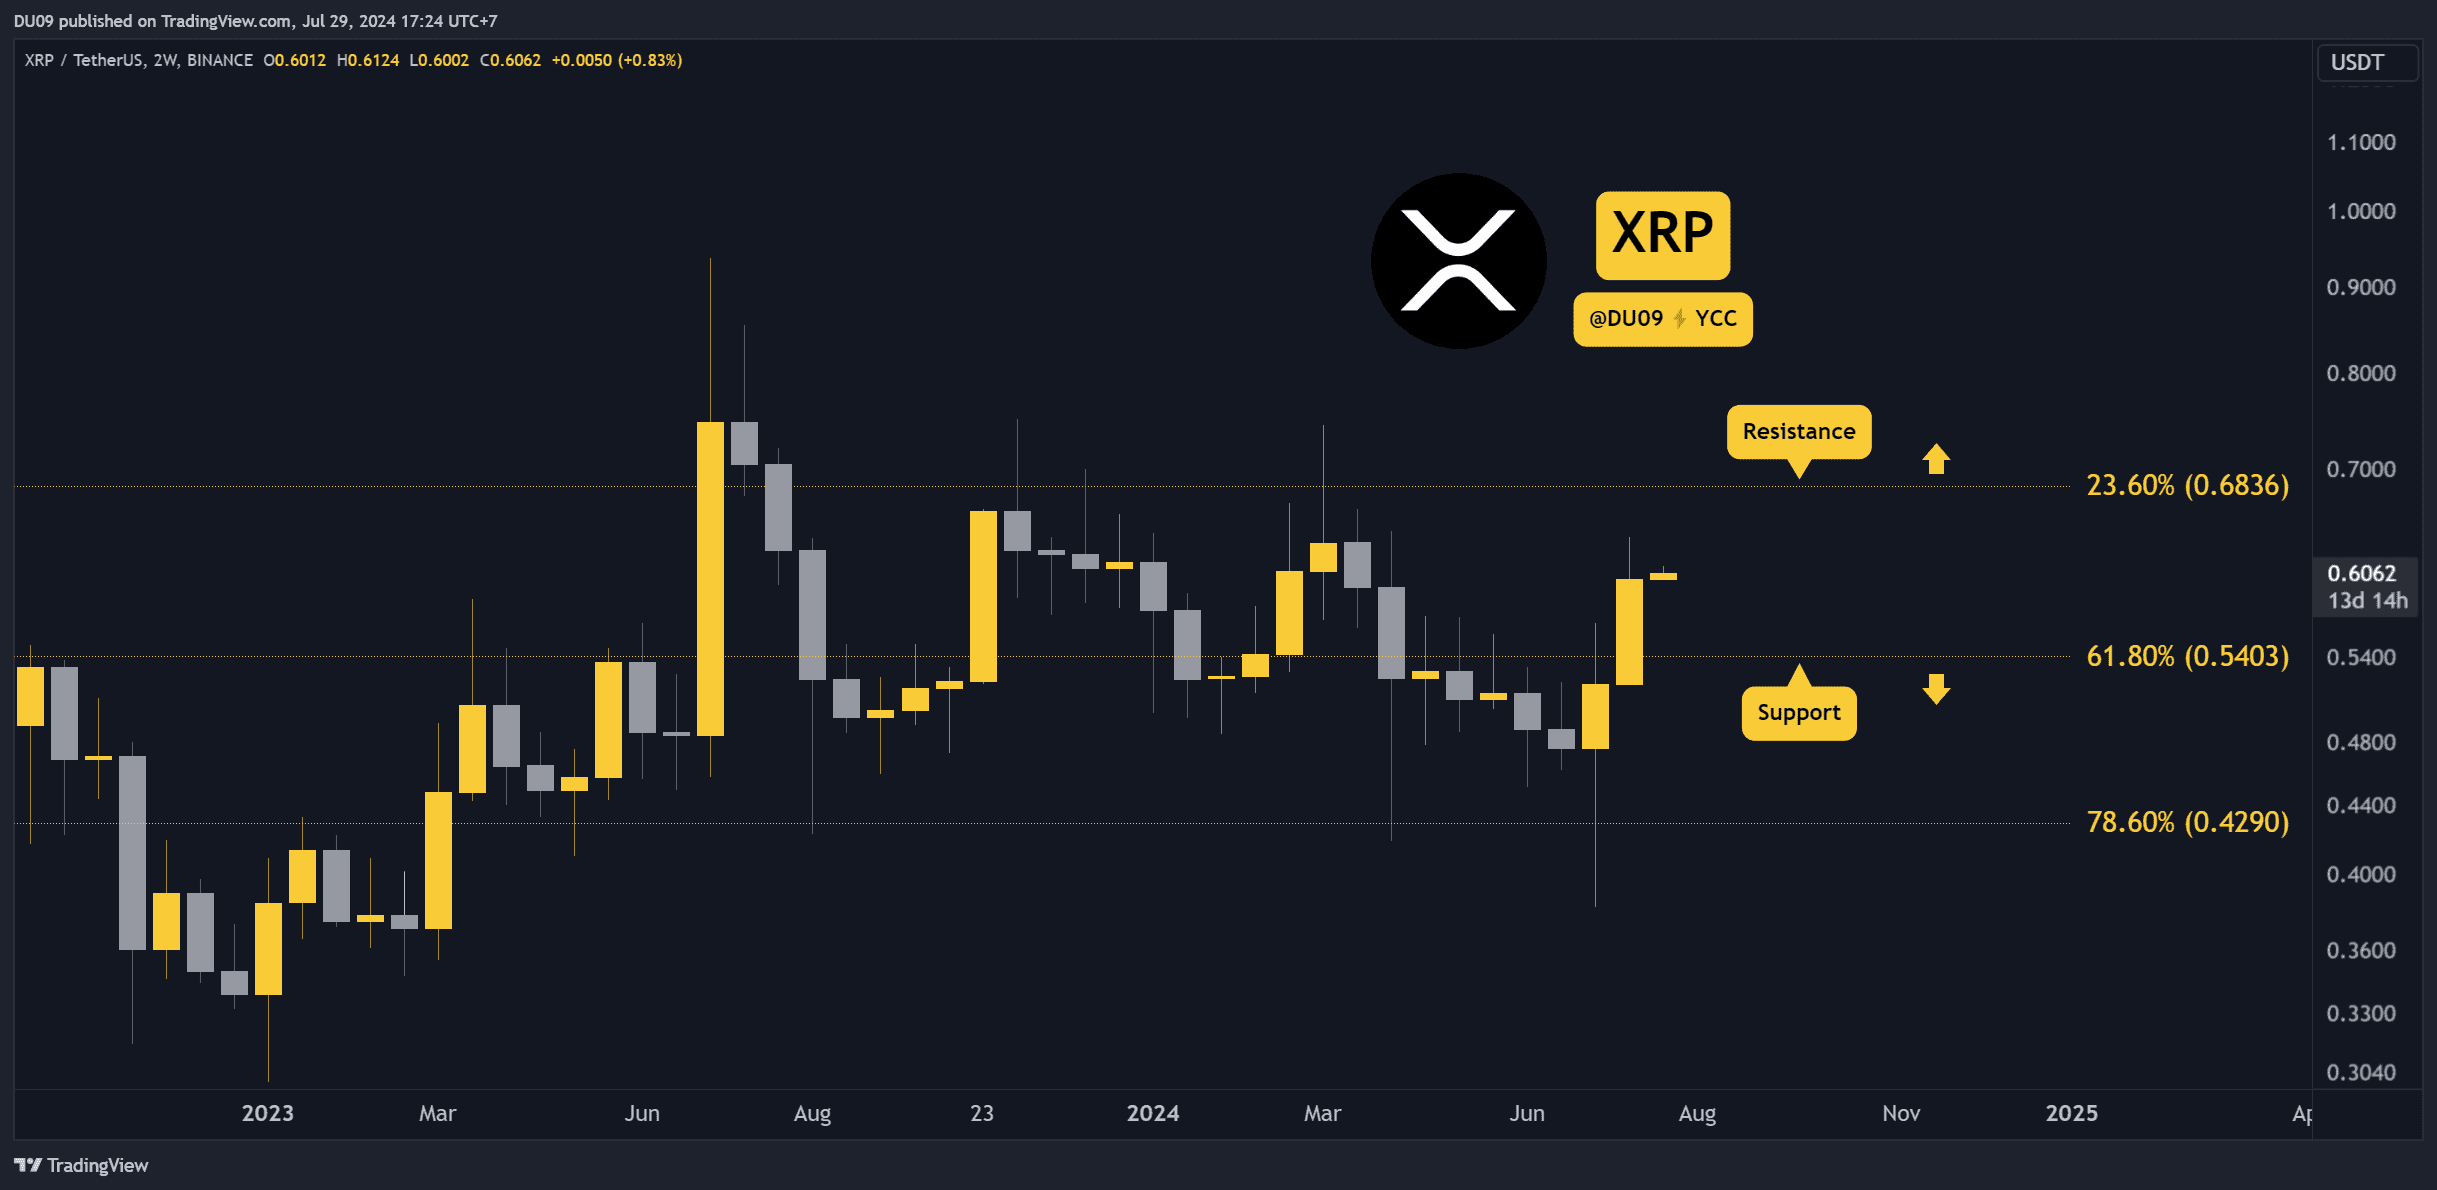
Key Support levels: $0.54
Key Resistance levels: $0.68
1. Bulls in Control
Sellers had several opportunities to make a stand, but they didn’t show up. Instead, XRP has been consolidating around 60 cents and appears keen to continue higher to challenge the resistance at 68 cents.
2. Decisive Moment Approaches
The price is compressing on lower timeframes such as the daily and it may soon try to escape its current range. If buyers manage to break out, they can quickly take the price to 68 cents. If they fail, the current support is found at 54 cents.

3. MACD Bullish Cross
The MACD moving averages just did a bullish cross on the two week timeframe. This follows a similar cross on the weekly timeframe a few weeks ago. This pattern is indicative of a major shift in the price action which favors bulls. If sustained, the resistance will likely be tested soon.
